YM Futures Explained: The E-mini Dow, $5 a Point
YM is the E-mini Dow Jones futures contract. One point is $5, one tick is $5, and the micro (MYM) is $0.50. In 2026 one YM contract moved about $2,390 on a normal day. Below are the specs, the symbols, how YM compares to ES and NQ, and what it actually did every session this year. I trade it every morning.
Published · by Joakim Jusell
YM in 30 seconds
- What it is: the E-mini Dow Jones futures on CME (CBOT). Tracks the 30 stocks in the Dow.
- 1 point = $5. 1 tick = 1 point = $5. Micro YM (MYM): $0.50 a point.
- 1 contract: about $260,000 of the Dow at 52,000. A normal 2026 day was 478 points, or $2,390.
- Hours: Sunday 6 PM to Friday 5 PM ET, with a break from 5 to 6 PM every day.
- vs ES: about three quarters of the dollar movement per contract and 1/16 of the volume.
- vs NQ: one NQ moves about three times the dollars of one YM, and they only agreed on direction 73% of days.
- Live price: on my futures prices page, overnight session included.
I trade YM every morning next to ES and RTY. Almost every page about YM is either a live quote or a spec sheet. That's fine if all you need is the tick value, and it's on this page too. But a spec sheet won't tell you how YM behaves once you're in a trade.
So I pulled every regular session of 2026 from 1-minute data and put YM next to ES and NQ. The numbers are further down. First, the basics.
What Is YM in Trading?
YM is the ticker for the E-mini Dow Jones Industrial Average futures. It's listed on CBOT, which is part of CME Group, and trades on Globex like ES. It tracks the Dow, which is 30 large US companies.
The Dow is different from every other index you'll trade because it's price-weighted. A stock's influence depends on its share price, not on how big the company is. A $500 stock moves the Dow ten times as much as a $50 stock. So a handful of expensive names carry the index, and one of them having an earnings day can move YM on its own. More on that below.
YM Contract Specs
| Spec | YM (E-mini) | MYM (Micro) |
|---|---|---|
| Tracks | Dow Jones Industrial Average | Dow Jones Industrial Average |
| Multiplier | $5 × index | $0.50 × index |
| Tick size | 1 point | 1 point |
| Tick value | $5.00 | $0.50 |
| Point value | $5 | $0.50 |
| Notional (Dow at 52,000) | About $260,000 | About $26,000 |
| Hours | Sunday 6:00 PM to Friday 5:00 PM ET, daily break 5:00 to 6:00 PM ET. Regular session 9:30 AM to 4:15 PM ET | |
| Expiry | Quarterly: March (H), June (M), September (U), December (Z). Third Friday of the month, most volume rolls the week before | |
| Settlement | Cash settled | |
| Margin | Several thousand dollars per YM at the exchange, changes with volatility. Day-trading margin at brokers is lower. Check your broker's current number | |
YM Point Value: What a Move Is Worth
YM is quoted in big numbers, above 50,000, with a small $5 point. That throws people coming from ES. When the news says "the Dow dropped 400 points", that's $2,000 on one YM contract, which is a normal day, not a crash.
| YM move | 1 YM | 1 MYM |
|---|---|---|
| 1 point (1 tick) | $5 | $0.50 |
| 10 points | $50 | $5 |
| 50 points | $250 | $25 |
| 100 points | $500 | $50 |
| 245 points (median first 30 min, 2026) | $1,225 | $122.50 |
| 478 points (median day, 2026) | $2,390 | $239 |
| 1,000 points | $5,000 | $500 |
For comparison, $500 of movement is 100 points on YM, 10 points on ES, 25 points on NQ and 10 points on RTY. All four contracts are side by side on the index futures cheat sheet.
YM Futures Symbol on Every Platform
The same contract shows up under different tickers depending on where you look. December 2026 is used as the example.
| Platform | Continuous | Specific contract |
|---|---|---|
| CME Globex | YM | YMZ6 |
| TradingView | YM1! | YMZ2026 |
| NinjaTrader | YM | YM 12-26 |
| thinkorswim | /YM | /YMZ26 |
| Yahoo Finance | YM=F | - |
| MarketWatch | YM00 | - |
| Barchart | YM*0 | YMZ26 |
| Micro (any platform) | MYM, MYM1! | MYMZ6 |
Is YM the Same as US30?
No. US30 is what CFD and forex brokers call their Dow product. It follows the same index, so the chart looks almost the same, but it's a different thing. YM is a futures contract traded on CME, with a public order book, fixed specs and exchange clearing. US30 is a contract with your broker. The broker sets the price feed, the spread, the contract size and the overnight financing, and there's no central volume to read.
CFDs aren't available to retail traders in the US. And if you want to read real order flow on the Dow, it has to be YM or MYM, because that's where the actual orders are.
1 YM Contract vs 1 NQ Contract
This is the YM question I get most. Both contracts pay $5 per tick, so people assume they're the same size. They're not close.
In 2026 one YM contract moved a median of 478 points in the regular session, which is $2,390. One NQ contract moved 370 points at $20 a point, about $7,400. So one NQ carries roughly three times the dollar risk of one YM. If you size by number of contracts, you aren't really sizing. Decide the dollar risk first and use the position size calculator to turn it into contracts.
They also don't move together as much as people think. Daily correlation between YM and NQ was 0.66 in 2026, and they closed in the same direction on only 73% of days. The Dow has little tech compared with the Nasdaq 100, so on days when money rotates out of tech and into everything else, YM goes up while NQ goes down. YM tracks ES much more closely: correlation 0.86 and the same direction on 83% of days. The NQ vs ES page covers the Nasdaq side.
| 2026, regular session | YM | ES | NQ |
|---|---|---|---|
| Point value | $5 | $50 | $20 |
| Tick value | $5 | $12.50 | $5 |
| Median day, points | 478 | 65 | 370 |
| Median day, dollars per contract | $2,390 | $3,238 | $7,400 |
| Median day as % of price | 0.92% | 0.87% | 1.32% |
| Correlation with YM | - | 0.86 | 0.66 |
| Same direction as YM | - | 83% of days | 73% of days |
YM vs ES in 2026: The Numbers
All of this is from 1-minute data for every regular session (9:30 to 16:15 ET) from January 2 to mid-October 2026, front-month contracts only. Same method as my ES statistics page.
| 2026 median | YM | ES |
|---|---|---|
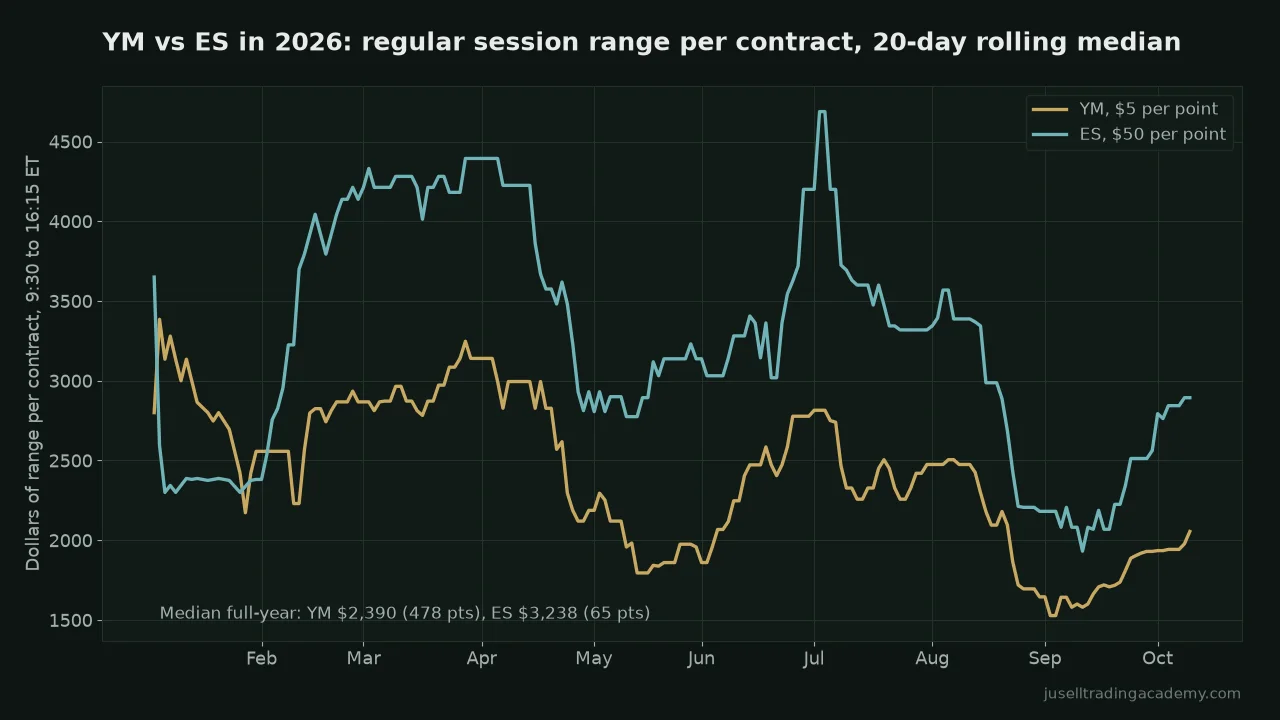
| Regular-session range | 478 pts ($2,390) | 64.8 pts ($3,238) |
| Range, 25th to 75th percentile | 354 to 634 pts | 45 to 85 pts |
| Range as % of price | 0.92% | 0.87% |
| Overnight range (6 PM to 9:30 AM) | 355 pts | 51 pts |
| First 30 minutes range | 245 pts (56% of the day) | 27 pts (43% of the day) |
| Regular-session volume | 67,700 contracts | 1,108,800 contracts |
| Overnight volume | 21,500 | 219,500 |
| Volume per minute, first 30 min | 530 | 5,198 |
| Volume per minute, 12 to 1:30 PM | 113 | 2,091 |
| Average 1-min bar range, first 30 min | 45 pts (45 ticks) | 5.2 pts (21 ticks) |
| Median daily move, close to close | 0.52% | 0.48% |
How YM Trades
Is YM liquid?
It's the thinnest of the four index futures. YM does about one-sixteenth of ES's volume: 530 contracts a minute at the open against 5,200 on ES, and 113 a minute at lunch. Even RTY does about twice YM's volume. With fewer orders at each price, YM moves in jumps. The 1-minute bars in the first half hour average 45 ticks against 21 on ES. Market orders at the open fill badly. Use limits, be patient, and trade smaller than you'd think.
How volatile is YM?
About the same as ES in percentage terms: 0.92% a day against 0.87%, and calmer than NQ (1.32%) or RTY. It looks wild on the chart because the ticks are small and the book is thin, so the price jumps a lot of ticks at once. In dollars it's the calmest of the four to hold through a move. Size it in dollars, not ticks, and it stops looking scary.
When does YM move?
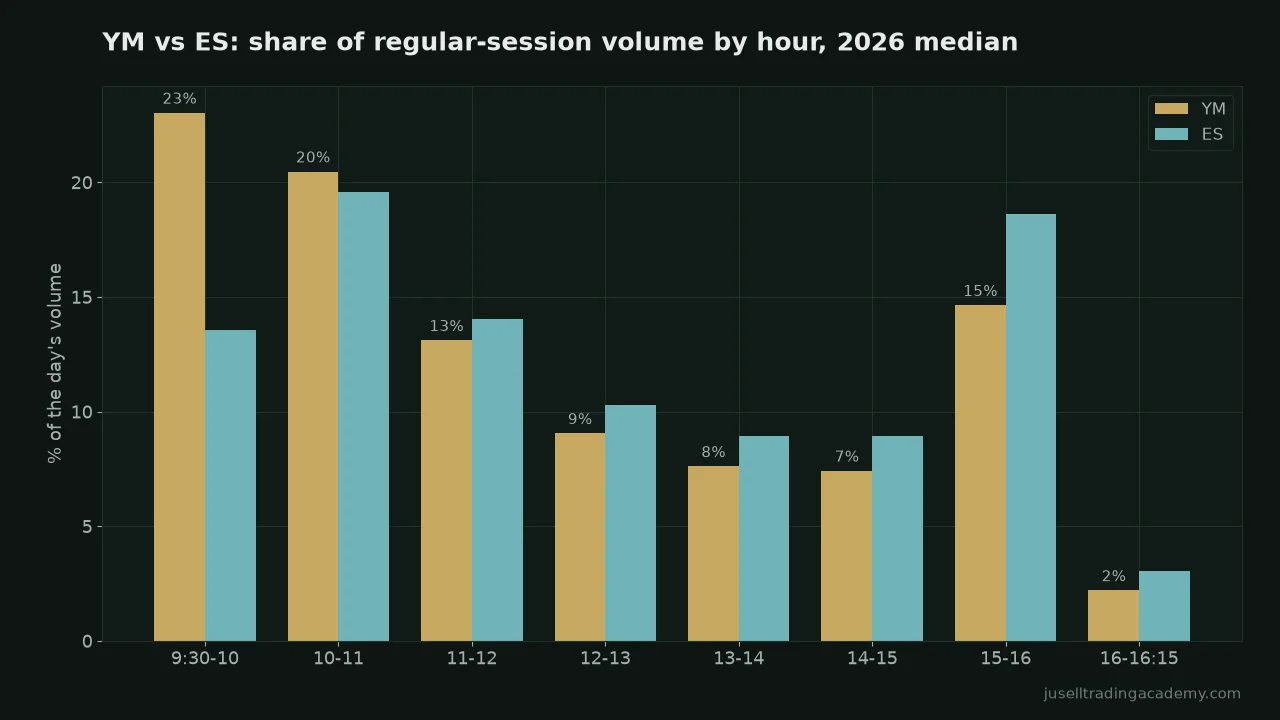
At the open. 56% of the day's range and 23% of the day's volume happen in the first 30 minutes, more front-loaded than ES or RTY. Most YM days have shown their range by 10:30, and by lunch the volume is a fifth of what it was at the open. Unlike RTY, the last hour isn't special: 15% of YM's volume against 20% for RTY.
Why does YM sometimes move on its own?
Because the Dow is price-weighted, a few expensive stocks carry it. When one of them reports earnings or gets hit by news, YM moves while ES and NQ barely react. That's where most of the 14% of days with a bigger dollar range than ES came from. Check the earnings calendar for the highest-priced Dow stocks. A 10% move in a $500 Dow stock is a few hundred YM points that have nothing to do with the rest of the market.
Does YM follow ES?
Mostly. Correlation 0.86 and the same direction on 83% of days. YM doesn't lead the way RTY sometimes does, but because the book is quieter, it often shows what's happening at a level more clearly. My YM trade review is a good example: the delta flip at the daily high was easy to see on YM.
Who Should Trade YM?
It's a better second market than a first one. The thin book punishes market orders, and single-stock news can run through your stop. Learn on ES or MES, where the book is deep, then add YM through the micro.
YM suits traders who want clean structure and a quieter book. The footprint reads well on YM because there are fewer participants, so absorption and big prints stand out, and in dollars the moves are manageable. I keep it on screen next to ES and RTY every morning.
Micro YM (MYM)
MYM is one tenth of YM: $0.50 per point and per tick. Ten MYM equal one YM. A median 478-point day is $239 per contract instead of $2,390, and a 60-point stop is $30 instead of $300. It trades the same hours and moves tick for tick with YM. The only downside is paying commission on ten micros if you want the size of one mini. The micro futures guide covers all four micros.
How I Trade YM
The same way I trade ES and RTY: levels from the profile and the overnight session, VWAP for who's in control, and the footprint to decide at the level. What changes is how I handle the contract.
- Size in dollars. One YM is about three quarters of an ES and a third of an NQ. Dollar risk first, contracts second.
- Be there for the open. More than half the day's range is done by 10:00.
- Limit orders. The book is thin, so market orders at the open cost you.
- Check the Dow earnings calendar. If a high-priced Dow stock reports today, YM is partly trading that one stock.
- ES on the second screen. They agree 83% of the time. When they don't, I want to know why before I trust the YM level.
Questions People Ask
What is YM in trading?
YM is the symbol for the E-mini Dow Jones futures contract, traded on CME Group's CBOT. It tracks the Dow Jones Industrial Average, the 30-stock price-weighted index. One contract is worth $5 per index point. The micro version, MYM, is $0.50 per point.
How much is 1 point on YM?
$5. YM moves in 1-point ticks, so one tick is also $5. On MYM, one point and one tick are both $0.50. A 100-point move is $500 on YM and $50 on MYM.
How much is a 1 YM futures contract?
With the Dow around 52,000 in October 2026, one YM controls about $260,000 of notional. You post margin, not the notional: several thousand dollars at the exchange and lower for day trading at most brokers. In 2026 one YM moved a median of 478 points, about $2,390, in a regular session.
Is YM the same as US30?
No. Both follow the Dow, but YM is an exchange-traded futures contract and US30 is a CFD with your broker, who sets the price, spread and financing. CFDs aren't available to US retail traders, and there's no central volume to read on them.
1 YM contract vs 1 NQ contract: which is bigger?
NQ, by a lot. Both pay $5 per tick, but in 2026 one NQ moved about $7,400 in a median regular session against $2,390 for one YM. That's roughly three times the dollar risk.
Are YM and NQ correlated?
Less than most people think. Daily correlation was 0.66 in 2026, and they closed in the same direction on 73% of days. YM tracks ES much more closely, at 0.86 and 83%.
What is the difference between YM and ES?
ES tracks the S&P 500 at $50 per point. YM tracks the 30-stock, price-weighted Dow at $5 per point. In 2026 one YM moved about $2,390 a day against $3,240 for ES, almost the same in percentage terms, with about one-sixteenth of the volume.
Is YM good for beginners?
It's a better second market than a first one. The book is thin and single-stock news can move it. Learn on ES or MES first, then add YM through MYM. How to trade ES futures is where I'd start.
What are the YM futures trading hours?
6:00 PM ET Sunday to 5:00 PM ET Friday, with a break from 5:00 to 6:00 PM ET every day. The regular session is 9:30 AM to 4:15 PM ET. In 2026 the first 30 minutes produced 56% of the day's range. The overnight session is covered separately.
Want to learn from a full-time trader who's in these markets every morning? My 1-on-1 mentorship is daily coaching on your own trades, five students at a time.
See 1-on-1 MentorshipKeep reading: RTY Futures Explained • ES, NQ, YM & RTY Cheat Sheet • YM Trade Review • NQ vs ES • Micro Futures Guide • All Free Resources