VWAP Explained: Session VWAP, Anchored VWAP, RTH vs ETH
What VWAP actually is, why price reacts to it, how to read it, the RTH and ETH difference that trips up most futures traders, bands, and anchored VWAP on news. Everything, with real ES charts. Not a strategy.
Published · by Joakim Jusell
The short version
- VWAP is the average price of everything traded since the anchor, weighted by volume. Above it the average buyer is in profit, below it the average buyer is underwater.
- It matters because big players are measured against it. That's why real money defends it and why price reacts to it.
- On futures there are two session VWAPs: RTH from 9:30 ET and ETH from 18:00 ET the night before. They can sit far apart, and you need to know which one your platform is drawing.
- Anchored VWAP starts the calculation at an event, like a news release or a swing low. It shows who's winning since that moment.
- VWAP is a read, not a signal. The line tells you where. Order flow tells you whether.
VWAP is on my chart every day. Volume profile tells me where value is, order flow tells me what's happening at a level, and VWAP tells me, in one line, who's paid more than the average today and who's underwater. It's one of the very few indicators I think belongs on a chart.
This is everything I'd want a trader to know about it. What it is, how it's calculated, why price reacts to it, how to read it, the RTH and ETH thing that most futures traders get wrong without knowing, bands, and anchored VWAP, which is the version I use most. No strategy here, on purpose. VWAP isn't a strategy. It's context, and once you can read it the chart looks different.
What Is VWAP?
VWAP stands for volume weighted average price. It's the average price everything has traded at since the session started, with every trade counted by its size. A 500-lot at 7740 moves the average a lot more than a 1-lot at 7760.
So the VWAP line is literally the average price paid by everyone who has traded today. If price is above it, the average buyer is in profit and the average seller is losing. If price is below it, the other way around. That's the whole idea, and everything else in this article is built on it.
It is not a moving average. A moving average looks back a fixed number of bars and treats every bar the same. VWAP looks back to a fixed starting point and weights by volume, so a big trade from 9:35 still counts at 3 PM. That's also why it slows down as the day goes on. By the afternoon there's so much volume behind it that a few minutes of trading can barely move it.
How VWAP Is Calculated
For every bar since the anchor, take the typical price, multiply it by the bar's volume, add all of those up, and divide by the total volume.
A quick example with three one-minute bars. Bar one: typical price 7740, 1,000 contracts. Bar two: 7745, 3,000 contracts. Bar three: 7750, 500 contracts. The plain average of the three prices is 7745. The VWAP is (7740 × 1,000 + 7745 × 3,000 + 7750 × 500) ÷ 4,500, which is about 7744.4. The big bar at 7745 pulls it, the small bar at 7750 barely matters.
Two details people ask about. Most platforms use typical price, some use the close, and some calculate from tick data instead of bars. The differences are small, usually a tick or two. The thing that actually changes the line is the anchor, which is the next section.
Why Institutions Care, and Why Price Reacts to It
A fund that needs to buy 5,000 ES contracts can't do it in one click without moving the market against itself. The order gets worked over hours, by a desk or an algorithm, and whoever is working it gets judged on one number: did they fill better than VWAP? Beat it and you did a good job. Miss it and you explain yourself. That's why VWAP execution algos exist, and it's why the line gets defended with real size.
When price dips to VWAP in an uptrend, buyers who are behind on their order get their chance, and they take it. When price pops up to VWAP in a downtrend, sellers who've been waiting get to sell at the average instead of chasing. You can watch this happen on a footprint chart. The test of VWAP is where the big prints show up.
It's also the fairest single number for "what's the price today". Everyone above it is paying up, everyone below it is getting a discount. Nobody defends a 20-period EMA with real money. Plenty of people defend VWAP.
How to Read VWAP
Four things, in the order I look at them.
Which side of it price is on
Above a rising VWAP, buyers are in control and dips to the line are where they add. Below a falling VWAP, sellers are in control and pops to the line are where they add. Simple, and most days that's all you need to know about who's winning.
The slope
The slope matters more than a cross. A cross of a flat VWAP means almost nothing, price is just moving through the day's average on a day that hasn't decided anything. A flat VWAP with price crossing back and forth is a balance day: fade the edges, don't chase, and expect the chop. A VWAP that's clearly sloping and holding price on one side is a trend day, and the first pullback into it is often the best trade of the day. My ES statistics show how often each type of day shows up.
Distance
The further price gets from VWAP, the more stretched the day is. On a normal day that stretch gets pulled back toward the average. On a trend day it doesn't, and price keeps going. The bands below put a number on it.
What happens at the test
This is the part most people skip. Price at VWAP is not a signal. It's a place to look at what the orders are doing. If price comes into VWAP from above and you see buyers absorbing the selling in the footprint, the line is holding. If sellers push through with size and the bids pull, it isn't. The level tells you where, the tape tells you whether. The first return to VWAP after a strong move tends to hold better than the third or fourth, because by then the side that was in control has had plenty of chances at the average price.
Session VWAP on Futures: RTH vs ETH
This is where most futures traders get it wrong without knowing. ES trades almost 23 hours a day, from 18:00 ET in the evening to 17:00 ET the next day, with a one-hour break. So "today" can mean two different things.
- RTH VWAP starts at 9:30 ET, when the cash market opens, and only counts the regular session.
- ETH VWAP starts at 18:00 ET the evening before and includes the whole overnight session.
Both are "the session VWAP". They're just different sessions, and your platform draws whichever one its session template tells it to. On a quiet night they end up close to each other. On the morning of September 4, 2026, the jobs report day, they didn't.
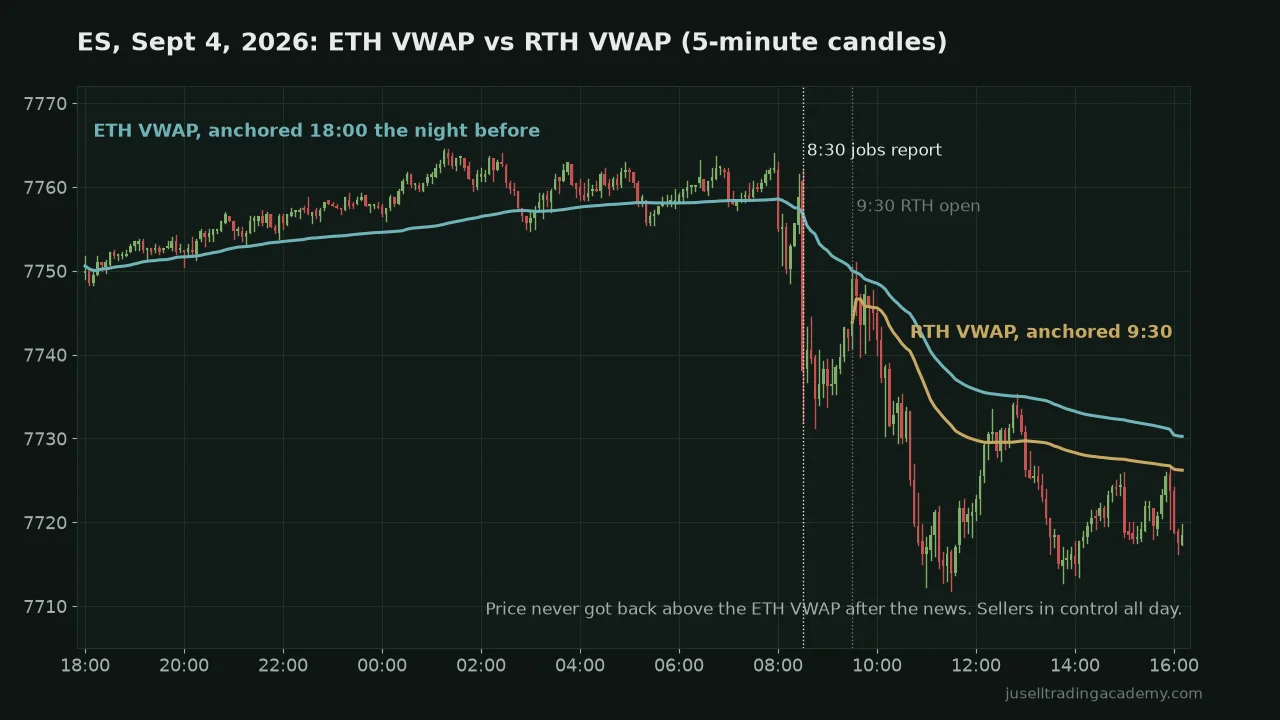
Which one should you use? Most of the volume is in RTH. On that day the regular session did about 970,000 contracts against roughly 194,000 overnight, so the RTH VWAP is what most cash-session participants are measured against. But the overnight is where the news hits and where the day's bias often gets set, and the ETH VWAP carries that memory. I keep both.
When they sit close together, the day usually hasn't decided anything yet. When they're far apart, the space between them is where the fight is. A move back into that gap means the side that was winning overnight is giving ground, and a rejection from it means they're still in charge. On September 4 price tested up toward the gap at the open, got turned away, and that was the day.
One practical thing: check your platform. If your chart is set to a 24-hour session, your "VWAP" is the ETH one. If it's set to RTH only, it's the RTH one. A lot of traders are reading one and thinking it's the other, and then wondering why VWAP "doesn't work". I go through the overnight session itself in pre-market futures explained.
VWAP Bands
Standard deviation bands around VWAP show how far price has stretched from the average, scaled to how wild the day has been. The usual settings are 1 and 2 standard deviations. On a calm day the bands are tight, on a news day they're wide, and they're calculated from the same cumulative data as the VWAP itself, so they settle down as the day goes on just like the line does.
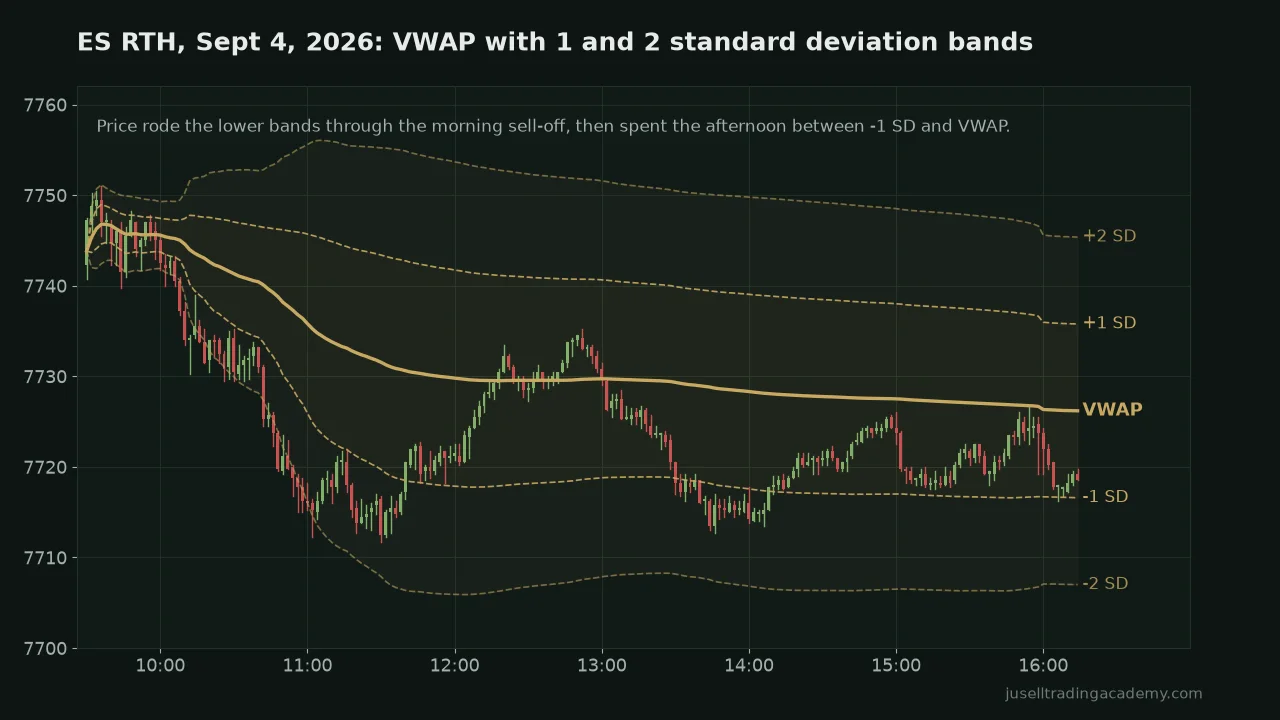
How I read them. Inside the first band, the day is near its average and nothing much is happening. At the second band price is stretched, and on a normal day the odds of a move back toward VWAP go up. On a trend day it's the opposite: price rides the first band for hours and the band becomes support or resistance, not a reversal zone.
That's the trap with bands. They look like buy and sell signals, and on the days that matter most they're exactly the wrong way round. Treat them as a measure of how stretched the day is, then look at the order flow at the band before you do anything.
Anchored VWAP
Session VWAP answers "what's the average price today?". Anchored VWAP answers "what's the average price since this thing happened?". It's the exact same calculation, you just pick the starting bar yourself.
Brian Shannon of Alphatrends did more than anyone to make this popular, and his book on it is worth your time. The idea is simple. The market remembers prices where a lot of business got done, and the volume weighted average since an important moment is the fairest line for who's winning since then. Everyone who bought after that moment is, on average, in profit above the line and underwater below it.
Where to anchor:
- A news release. CPI, the jobs report, FOMC. More on this in the next section.
- An open. The 9:30 RTH open and the 18:00 Globex open. These are just the two session VWAPs above, so you're already using anchored VWAP, you just didn't pick the anchor yourself.
- A major swing high or low. The low of a big sell-off, the high of a rally. The VWAP from that point tells you whether the move off it is still being bought or sold.
- The first bar of the week or the month. Weekly and monthly VWAPs are anchored VWAPs with a calendar anchor.
- A gap, or for stocks an earnings day. Anything where a lot of people changed their mind at once.
The rule I follow: anchor to something other traders also see. An anchor at a random bar is just a line on your chart. An anchor at the CPI candle is a level every desk is watching too, and that's what makes it react.
Anchoring VWAP to News
This is the version I use most. At 8:30 ET on a CPI or jobs day, or at 14:00 on an FOMC day, the first minute is noise. Then the real fight starts. I anchor a VWAP to the release bar, and from then on that line is the average price of everyone who has traded since the news. It tells me whether the people who acted on the number are in profit or getting squeezed.
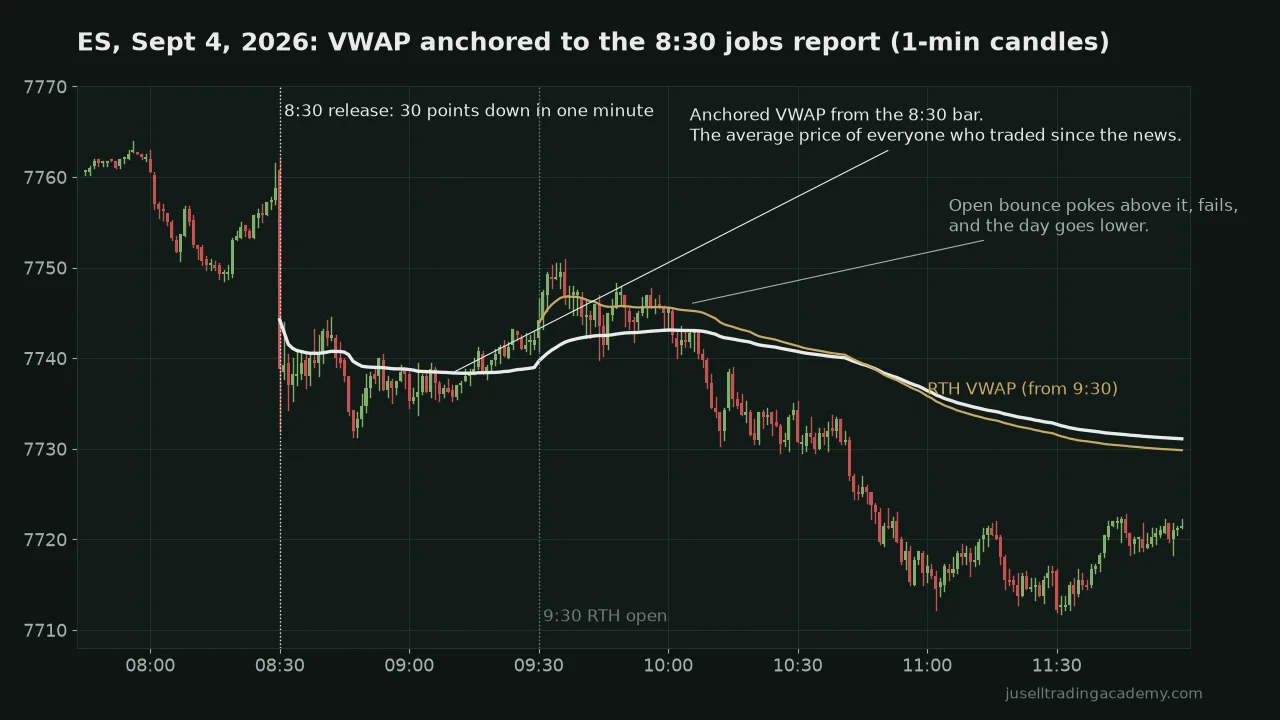
How to read it. When price holds above the news VWAP, the buyers who bought the number are in profit and they defend it, so dips into the line are where they add. When price loses it, the news move is failing and the other side has control. The first test after the initial move is the one I pay most attention to. On September 4, the test came at the open, it failed, and there was no reason to look for longs the rest of the morning.
Two things to keep in mind. The anchor has to be the release bar itself, not the bar before or after. And on a number that gets reversed hard in the first few minutes, the anchored VWAP can sit right in the middle of the spike, which is fine. Price chopping around it means the market hasn't agreed on what the number meant yet, and that's useful to know too.
VWAP Settings
There are no magic settings. These are the three that matter.
| Setting | What to use | Why |
|---|---|---|
| Session | RTH (9:30 ET) or ETH (18:00 ET) | This is the one that actually changes the line. Know which one you're looking at |
| Source | Typical price, (high + low + close) ÷ 3 | The standard. Close works too, the difference is a tick or two |
| Bands | 1 and 2 standard deviations | Measures how stretched the day is. More than two bands is clutter |
| Anchored | The release bar, the open, or a major swing | Use anchors other traders see, not random bars |
| Timeframe | Any | VWAP is cumulative, so it's the same line on a 1-minute and a 15-minute chart |
Every serious platform has it. TradingView has a session VWAP with a bands option and an anchored VWAP drawing tool. MotiveWave, NinjaTrader and Sierra Chart all have VWAP and anchored VWAP built in or as a free study. What you want to check in all of them is the session template, because that decides RTH or ETH for you.
VWAP vs Moving Averages vs TWAP
| VWAP | Moving average | TWAP | |
|---|---|---|---|
| Looks back | To a fixed anchor | A fixed number of bars | To a fixed anchor |
| Weighting | By volume | Equal, or by recency | By time, every minute equal |
| What it tells you | The average price paid | Where price has been | The average price over time |
| Who uses it | Institutions as a benchmark | Mostly retail | Execution algos spreading orders evenly |
| Problem | Thin overnight volume barely moves it | Lags, and nobody defends it | Thin overnight hours count as much as the open |
For reading the market, VWAP wins. A moving average is a formula about the past. VWAP is a fact about the day.
Common VWAP Mistakes
- Wrong session. Reading the ETH VWAP and thinking it's RTH, or the other way round. Check the template.
- Treating a touch as a signal. Buying because price hit VWAP. The line is where you look, the orders decide.
- Fading the bands on a trend day. The days that run are the days price rides the band. The bands tell you the day is stretched, they don't tell you it's over.
- Trusting it in thin hours. Overnight, a few big prints can swing a fresh VWAP around. It gets reliable once there's volume behind it.
- Anchoring to things nobody else sees. Your personal anchor at 10:47 doesn't make a level. The CPI bar does.
- Too many lines. Daily, weekly, monthly, three anchors and bands on all of them. Pick the two or three that answer a question you actually have.
How VWAP Fits With Volume Profile and Order Flow
VWAP on its own is one line. With market profile and order flow it becomes a full read of the day. The profile shows me where value is, the point of control and the value area. VWAP shows me the average price paid and which side is winning. When those two agree, say VWAP is rising and sitting at the top of value, that's a day where I'm only looking at longs on pullbacks. When they disagree, I wait.
Then, at the actual test, I look at the footprint. Is the selling into VWAP getting absorbed? Are the bids holding or pulling? That's the decision. VWAP tells me where. The order flow tells me whether. That's the whole relationship, and it's the same one I teach.
Questions People Ask
What is VWAP in trading?
The volume weighted average price: the average price everything has traded at since the session started, with each trade counted by its size. It's the average price paid by everyone who traded today, so above it the average buyer is in profit, below it the average buyer is underwater.
What does VWAP stand for?
Volume Weighted Average Price. The weighting is the important part. A 500-lot moves the average far more than a 1-lot, which is why VWAP reflects where real size got done, not just where price has been.
How is VWAP calculated?
For every bar since the anchor, multiply the typical price (high plus low plus close, divided by three) by the bar's volume. Add those up and divide by the total volume. It's cumulative, so it restarts at the anchor and gets heavier and slower to move as the day goes on.
What are the best VWAP settings for day trading?
There are no magic settings. The three that matter: the right session (RTH from 9:30 ET or ETH from 18:00 ET), typical price as the source, and bands at 1 and 2 standard deviations. If your session template is wrong, your VWAP is wrong no matter what else you set.
What is anchored VWAP?
The same calculation started at a bar you choose instead of the session open: a news release, the RTH open, a swing high or low, the start of the week. It shows the average price of everyone who has traded since that event, which tells you who is winning since then. Brian Shannon of Alphatrends made it popular.
What is the difference between VWAP and TWAP?
TWAP is the time weighted average price. It treats every minute the same regardless of how much traded. VWAP weights by volume. For reading the market VWAP is more useful, because thin periods like the overnight don't pull it around the way they pull a time average.
Does VWAP work on futures like ES and NQ?
Yes, and index futures are where it works best because the volume is huge and institutions benchmark against it. The one thing to get right is the session. There's an RTH VWAP from 9:30 ET and an ETH VWAP from 18:00 ET the evening before, and they can sit far apart.
Is VWAP a good indicator for beginners?
It's one of the few I'd put on a beginner's chart, because it isn't a lagging formula, it's a fact about the day. The mistake beginners make is treating a touch of VWAP as a buy or sell signal. It's a place to look at what the orders are doing, not a signal on its own. If you're starting out, how to trade ES futures is the place to begin.
If you want to learn to read the market this way, VWAP, profile and order flow on your own trades every day, with someone checking your work, that's what my trading mentorship is. Five students at a time, and I trade the same session you do.
See 1-on-1 MentorshipKeep reading: Volume Trading Guide • Market Profile • Order Flow Trading • Footprint Chart • Pre-Market Futures • ES Statistics • All Free Resources