Order Flow Trading: How to Read What Indicators Can't
A full futures trader's guide to order flow trading: what it is, how to read it, and the exact strategy I use to time entries.
Published April 11, 2026 · Updated October 3, 2026
The full order flow series
- Footprint chart trading: how to read delta, the POC in each bar and exhaustion
- Absorption trading: big orders that don't move price
- Order flow entry signals: the step-by-step entry
- Liquidity sweeps and stop runs: the setup at the obvious highs and lows
- Tape reading: how to read time and sales, and where it still helps
- VWAP vs volume profile: where the volume says value is
- MotiveWave review: the platform I read it all on
Most retail futures traders enter based on signals that have already happened: moving average crosses, RSI readings, or closed candle patterns. By the time the indicator confirms, the move is half done, and the risk-to-reward is gone.
Order flow trading is different. You watch the actual buy and sell orders as they hit the tape, not the lines an indicator paints after the fact. Done right, you see who's winning the fight at a level before the candle even closes.
This is the pillar guide. Below I cover what order flow is, how I read it, and the strategy I run every day on index futures. The strategy itself is broken out in more detail in order flow trading strategy: entry signals that work, the absorption pattern in what is absorption in trading, and the volume side in volume profile and VWAP for day traders.
What Is Order Flow Trading?
Order flow trading means making decisions from the live buy and sell orders hitting the market, instead of from indicators built on old price data. A moving average tells you what happened. Order flow tells you what's happening.
There are three players you're always watching:
- Aggressive buyers -- they lift the offer with market buy orders. They want in now and don't care about a tick or two of slippage.
- Aggressive sellers -- same thing, other direction. They hit the bid with market sells.
- Passive orders -- the limit orders sitting on bid and offer, waiting to be hit. Big institutional orders almost always sit passively because they're too large to just send and not move price.
The fight between those three is the order flow. If you can read it, you stop guessing what candles "mean" and start seeing the actual decisions behind them. It's the same data the prop and bank desks have been using for decades. Retail traders just got real access to it relatively recently.
How to Read Order Flow (and Why You Need a Level First)
Order flow data never stops. Delta shifts, absorption, and volume imbalances are happening on every bar at every price all session long. If you try to trade every interesting read, you'll burn through commissions and attention before lunch.
So you filter. The filter is a real level. Not a moving average. A price where actual orders are sitting -- overnight high, a stack of daily highs, a fat volume node from yesterday, prior day VWAP, the developing point of control. Those are the prices where the algos already have orders staged. When the market gets there, your order flow reads actually carry weight.
Without that context, you're staring at noise. Everything below -- delta, absorption, resolution -- only works because we waited for a level first.
Watch the Delta
Delta is the net difference between aggressive buyers (who submit market buy orders, which are orders to buy immediately at the best available price) and aggressive sellers (who submit market sell orders, which are orders to sell immediately at the best available price) at a given price. It tells you which side is pushing.
What I'm looking for at a key level is a delta shift. Say the price is running up to the overnight high with a strong positive delta, indicating aggressive buyers are in control and driving the move. That's expected. The interesting part comes when the price reaches the level, and the delta flips. Suddenly, sellers are more aggressive than buyers.
What a Delta Shift Tells You
That shift is the first signal. It tells you the market's character has just changed at a price that matters. But a delta shift at a level is expected. That's what levels are for: they attract the other side. The shift alone doesn't tell you who's going to win.
Look for Absorption
Absorption takes place when traders place many market orders on one side, meaning they buy or sell aggressively, but the price does not move as expected.
Here's what it looks like: sellers hammer the offer, delta turns negative, volume rises, but price stays flat. This means passive buyers sit on the bid, absorbing every sell order without letting the price drop. Or vice versa.
This creates a tug-of-war, where the real information lies. Absorption means a legitimate fight between two sides with conviction. The trade comes from resolving that fight.
Many traders act immediately on absorption, betting on the passive side. But absorption only signals a battle. Sometimes the passive side holds; sometimes it's overwhelmed. Wait for resolution.
Trade the Resolution
After the absorption phase, one side breaks through. That's your entry.
In a short setup, it looks like this: price ran up to a key level on strong buying. Delta shifted at the level. Sellers came in but were absorbed by passive buyers. Then the selling intensified, the passive buyers on the bid got overwhelmed, and the price dropped. The breakout buyers who entered at the high are now trapped, and their stop losses are adding fuel to the move as the price moves away.
That resolution, when one side finally overwhelms the other after the absorption phase, is the trigger. The level gave you the location. Delta gave you the shift. Absorption showed you the fight. The resolution told you who won.
Example: Order Flow Review on RTY
Here's a real example showing each phase in action on the Russell 2000 futures (RTY):
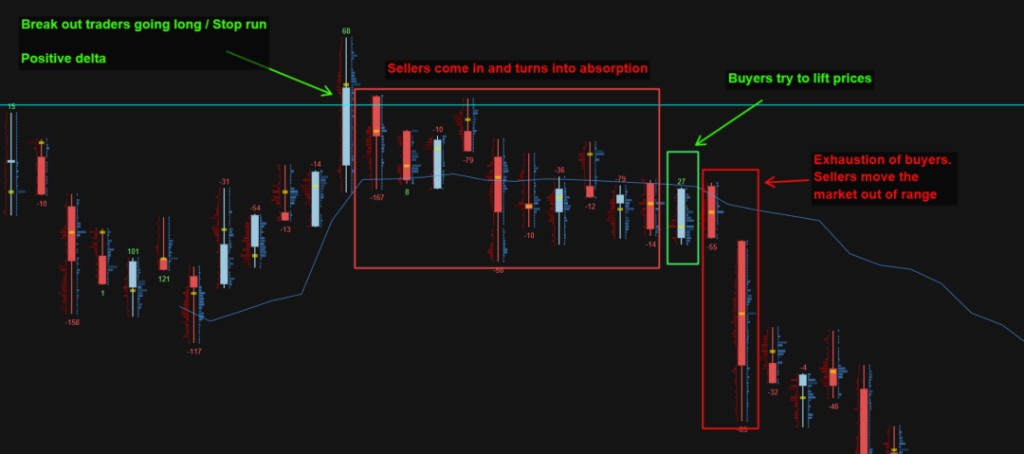
RTY footprint chart with per-bar delta values (green = positive/net buying, red = negative/net selling). Price sweeps the daily high on strong positive delta, sellers step in and get absorbed (red box), buyers attempt one more push but exhaust (green box), and sellers finally overwhelm to break the range lower.
Common Mistakes with Order Flow
Delta shifts and absorption patterns happen constantly throughout the session. They're only meaningful at prices where institutional orders are clustered. No level, no edge.
Absorption means there's a fight. Taking a position before knowing the winner is just a coin flip.
Volume tells you how much participation there is. Delta tells you which side is more aggressive. A bar can have a massive volume with a flat delta, indicating that buyers and sellers were equally aggressive. That tells you something completely different from a high-volume bar with a strong directional delta.
Order flow only works with real participation. On low-volume sessions, delta readings are thin, and absorption patterns are unreliable. My best trading days were when I recognized early that the data wasn't clean enough and walked away.
The Order Flow Trading Strategy in One Page
If someone asks me what my order flow strategy is, this is the answer:
- Mark levels before the open. Overnight high and low, prior day high and low, prior day VWAP, the big volume nodes. Those are the only places I'm willing to trade.
- Wait for price to get there. If price spends the morning between levels, I sit on my hands. There's no edge in trading order flow at random prices, no matter how good the read looks.
- Watch the delta shift at the level. Buyers pushed into resistance and now sellers are taking over? Something changed. That's a flag, not a trade.
- Look for absorption. Heavy aggression that can't move price means a passive trader is sitting there eating it. The bigger the absorption, the bigger the position behind it.
- Enter on the resolution. One side gives up. That's the trigger. Bonus fuel from the trapped traders' stops firing.
- Stop just past the absorption zone. If the absorber gives up, my read was wrong. I'm out, no debate.
- First target is the next opposing level. Order flow gets me in early. Price action levels tell me where to scale or exit.
That's it. Every trade I take on ES, YM, or RTY is some version of this. The hard part isn't the steps -- it's seeing the absorption clearly and pulling the trigger when it shows up. For the same strategy with annotated charts, see order flow trading strategy: entry signals that actually work.
Order Flow Indicators and Tools
"Order flow indicator" is a slightly misleading phrase. None of these tools spit out a buy or sell signal. They just make the live order flow data readable so you can apply the strategy on top. The ones I get asked about most:
- Footprint chart -- shows the buy and sell volume at every price inside each candle. If you're starting out, this is the one to learn. Detailed in what is absorption in trading.
- Cumulative delta -- a running total of aggressive buying minus aggressive selling. I mostly use it for divergences. Price grinding to a new high while delta is flat or rolling over usually means the move is running on fumes.
- Depth of market (DOM) -- the live order book. Useful if you're scalping. On index futures the DOM gets spoofed so much that I rarely look at it for swing-of-the-day decisions.
- Volume profile and VWAP -- not strictly order flow, but they tell you where the heavy trade happened and where the day's mean is. That's where your levels come from. See volume profile, VWAP and cumulative delta.
- Time and sales (the tape) -- the original, covered in my tape reading guide. Still the fastest way to feel what's happening when you're already in a trade and can't take your eyes off the screen.
For platforms, I use MotiveWave (here's my honest MotiveWave review), and Sierra Chart, NinjaTrader (with an order flow add-on), ATAS, Bookmap, and Jigsaw all do the job too. Pick one and stop hopping. I lost six months early on switching platforms instead of actually learning to read order flow on any of them.
Order Flow Trading vs Technical Analysis
People treat these like they're opposites. They're not. They do different jobs.
Technical analysis tells you where to look. Trend, range, support, resistance, prior session levels, daily highs and lows. The map. Built from price history.
Order flow tells you when to act once you're at one of those locations. Are the buyers at the prior day high real or stop-run fuel? Do the sellers at resistance actually have size, or are they tiny and about to get run over? Is there absorption forming, or just chop?
Trading order flow without levels is gambling on noise. Trading levels without order flow is putting on blind shots and hoping. Both on their own underperform. The combo is where the edge actually lives.
Why Order Flow Trading Works
Order flow works because you're watching what participants are doing, not what a formula spits out about what they did. Every indicator is downstream of price. Order flow is one step closer to the source -- the actual orders that move price in the first place.
That doesn't make it easy. It took me the better part of a year to stop second-guessing my reads in real time. Reading delta and absorption at the right levels, while running risk and not letting psychology wreck the entry, takes serious screen time. But the day the patterns finally click is the day you stop reacting to candles and start reading what's actually going on under them.
And once you're there, it's hard to go back.
Order Flow Trading FAQ
You make decisions from the live buy and sell orders hitting the market, not from indicators built on past prices. You watch who's being aggressive, who's absorbing it passively, and you act when one side wins.
The concepts can be explained in an afternoon. The pattern recognition takes months. For me it was about 8 months of daily screen time before I trusted my own reads in real time. Most people I mentor need somewhere between 3 and 9 months depending on how much they're at the screen.
For short-term futures and large-cap stock trading at real levels, yes. Order flow is closer to the cause and indicators are downstream of it. For longer holding periods the gap shrinks fast. Order flow's edge is in intraday timing.
Not really as the main tool. The data resets, participants change, and a multi-day position doesn't care what the tape did at 10:14 AM Tuesday. You can use order flow to fine-tune a swing entry, but you'd manage the position off price action and levels.
For futures, yes. You need real CME data and a platform with footprint and DOM. The free retail platforms don't have what you need. Budget at least $100-150 a month between data and platform if you're serious.
Want to learn order flow 1-on-1 with real-time guidance? That's what my trading mentorship is built around.
Book Your Intro Session ($20)More from the Academy: Orderflow Entry Signals • Absorption Trading • Market Profile (TPO) Guide • Volume Guide • YM Trade Review • Risk Management • Day Trading Guide • All Free Resources