RTY Futures Explained: How the Russell 2000 Futures Really Trade
The specs, the micro, and then the part no spec sheet gives you: 2026 numbers on how RTY moves, how thin it is, when the volume shows up, and how it behaves next to ES. From someone who trades it every morning.
Published · by Joakim Jusell
The short version
- RTY is the E-mini Russell 2000 futures contract on CME. $50 per point, $5 per 0.10 tick. The micro, M2K, is $5 per point.
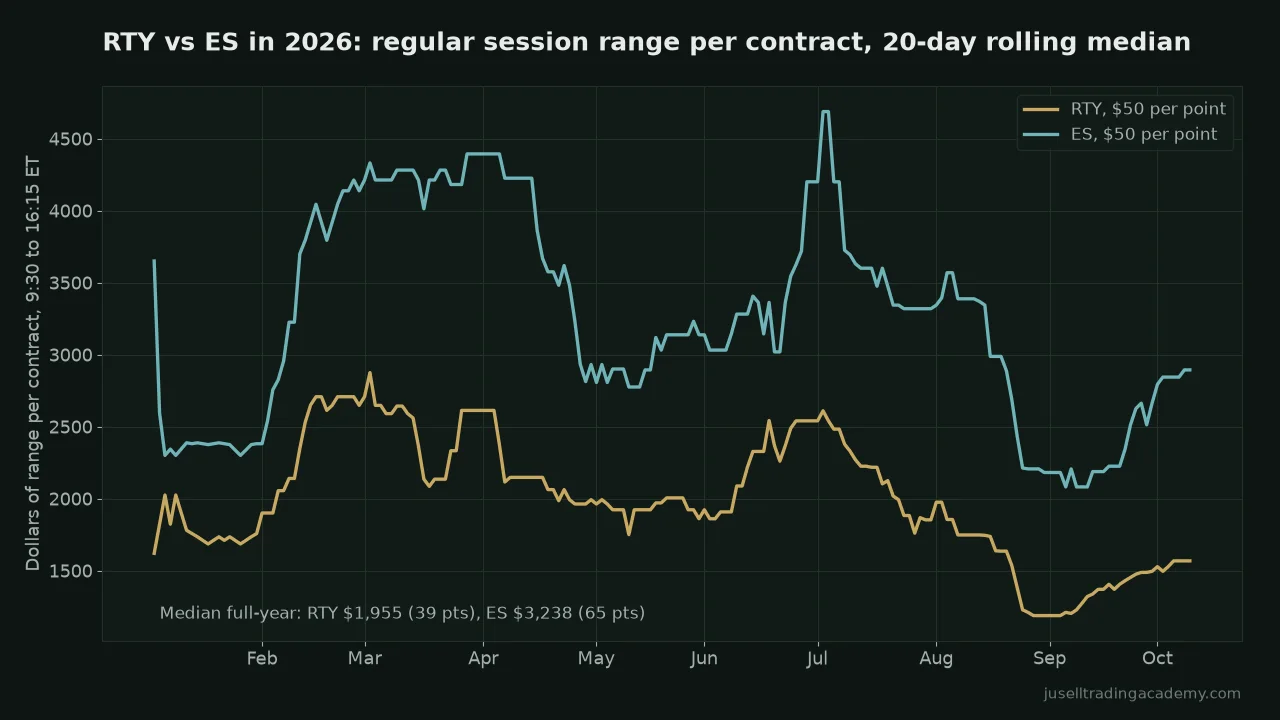
- In 2026 the median regular-session range was 39 points, about $1,950 per contract, against 65 points and $3,240 for ES. Smaller in dollars, bigger in percent.
- It's thin. About one-eighth of ES volume, and the 1-minute bars at the open average 36 ticks. It jumps, and it fills worse.
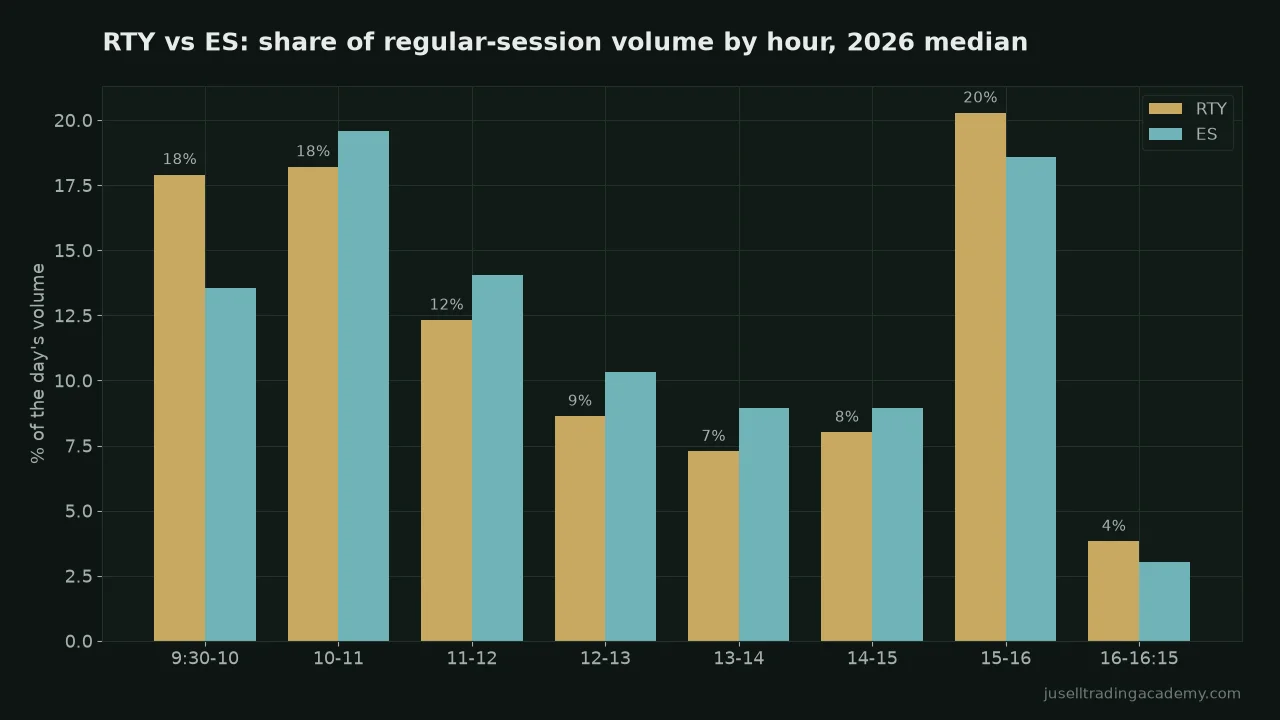
- The open is everything: 52% of the day's range happens in the first 30 minutes. And the 3 to 4 PM hour carries more volume than any other.
- It follows ES 85% of the time, moves about 1.15 times as much, and the days it doesn't follow are the interesting ones.
I trade ES, YM and RTY every morning. Of the three, RTY is the one people know least about and the one most guides get wrong, because most guides are a rewrite of the CME spec page by someone who has never had a position in it.
So this page has the specs, because you need them, and then the things you only learn with money in it, backed by every regular session of 2026 so far from 1-minute data. If you've only traded ES, read the second half twice. RTY is not ES with a different number.
What RTY Is
RTY is the ticker for the E-mini Russell 2000 futures, traded on CME Globex. It tracks the Russell 2000, which is the bottom 2,000 stocks of the Russell 3000 by market cap: the US small caps. Where ES is Apple, Microsoft and Nvidia, RTY is regional banks, biotechs, industrials and a lot of companies you've never heard of. That difference is the whole personality of the contract.
The Russell futures moved from ICE to CME in 2017, and the micro version, M2K, launched in 2019 alongside MES and MNQ. On most platforms you'll see it as RTY with a month code (RTYZ6 for December 2026), or as a continuous contract like RTY1! on TradingView. The index itself is often quoted as RUT, and the ETF most people know is IWM.
RTY Contract Specs
| Spec | RTY (E-mini) | M2K (Micro) |
|---|---|---|
| Tracks | Russell 2000 index | Russell 2000 index |
| Multiplier | $50 × index | $5 × index |
| Tick size | 0.10 points | 0.10 points |
| Tick value | $5.00 | $0.50 |
| Point value | $50 | $5 |
| Notional (index at 2,830) | About $141,500 | About $14,150 |
| Hours | Sunday 6:00 PM to Friday 5:00 PM ET, daily break 5:00 to 6:00 PM ET. Regular session 9:30 AM to 4:15 PM ET | |
| Expiry | Quarterly, March (H), June (M), September (U), December (Z). Third Friday of the month, most volume rolls the week before | |
| Margin | Exchange maintenance margin is a few thousand dollars per RTY contract and changes with volatility. Brokers offer day-trading margins well below that. Check your broker's current number, not a blog's | |
Two things to notice. First, RTY and ES are both $50 per point, but RTY trades at roughly 2,800 while ES trades at roughly 7,400, so one RTY contract is a lot less notional and, as you'll see below, a lot less dollar movement per day. Second, the tick is 0.10 and worth $5, which is the same tick value as NQ and YM, not ES's $12.50. I compare all four on the index futures cheat sheet.
RTY vs ES in 2026: The Numbers
Everything below is from 1-minute data for every regular session (9:30 to 16:15 ET) from January 2 to October 9, 2026, front-month contracts only, same method as my ES statistics page.
| 2026 median | RTY | ES |
|---|---|---|
| Regular-session range | 39.1 pts ($1,955) | 64.8 pts ($3,238) |
| Range, 25th to 75th percentile | 30 to 52 pts | 45 to 85 pts |
| Range as % of price | 1.36% | 0.87% |
| Overnight range (6 PM to 9:30 AM) | 28 pts | 51 pts |
| First 30 minutes range | 19 pts (52% of the day) | 27 pts (43% of the day) |
| Regular-session volume | 140,700 contracts | 1,108,800 contracts |
| Overnight volume | 29,000 | 219,500 |
| Volume per minute, first 30 min | 866 | 5,198 |
| Volume per minute, 12 to 1:30 PM | 230 | 2,091 |
| Average 1-min bar range, first 30 min | 3.6 pts (36 ticks) | 5.2 pts (21 ticks) |
| Median daily move, close to close | 0.67% | 0.48% |
How RTY Actually Trades
It's thin, and you feel it
RTY does about one-eighth of ES volume. At the open that's 866 contracts a minute against 5,200 on ES, and by lunchtime it's 230 a minute. The book is thinner at every price, so the same size of order moves RTY further, and the 1-minute bars at the open average 36 ticks of range against 21 on ES. In practice: it jumps, it gaps through levels that ES would grind through, and a market order at 9:31 costs you more than you think. This is the single biggest adjustment coming from ES. You size smaller, you use limits where you can, and you accept that a stop in RTY gets hit by a wick more often.
Bigger in percent, smaller in dollars
RTY moved 1.36% in a median day against 0.87% for ES, and its close-to-close moves are about 1.15 times ES's. Small caps are higher beta, and in a year with rate moves they get hit harder both ways. But because the index trades at a lower price, one RTY contract is about 60% of the dollar swing of one ES. People get this backwards in both directions: they think RTY is "the wild one" and size it down too much in micros, or they think "it's only $50 a point like ES" and forget it moves more than ES relative to its price. Know which one you're doing.
The open is everything
52% of the day's range is done in the first 30 minutes. On ES it's 43%. If you trade RTY, you trade the open, or you trade the leftovers. The flip side is that the middle of the day is dead: volume drops to a quarter of the open and the bars get small. That's not the time to be looking for RTY trades.
The last hour is the biggest
This one surprises people. RTY's 3 to 4 PM hour carried 20% of the day's volume in 2026, more than the opening hour. Small-cap index funds rebalance into the close, and the closing auction in 2,000 thin stocks pulls a lot of futures hedging with it. So RTY often does something in the last hour that ES doesn't. If you're flat by 3 PM you're missing a real session, and if you're holding into it with a tight stop you're about to learn why.
It follows ES, until it matters
Daily correlation with ES was 0.84 in 2026 and they closed in the same direction on 85% of days. Most of the time, RTY is ES with more noise. The 15% of days they split are the ones worth paying attention to, because small caps react first to rates, to credit, and to the economy getting better or worse. When ES is grinding up and RTY won't follow, or RTY turns up off a low while ES is still making new lows, that divergence tends to resolve toward RTY. I'd always have an ES chart next to an RTY chart for this reason.
Rates and the reconstitution
Small caps carry more debt and more floating-rate debt than large caps, so CPI, FOMC and anything that moves the 2-year yield hits RTY harder than ES. It's the index that moves most on a rate cut or a hot inflation print, in both directions. And twice a year the Russell indexes are reconstituted, in June and now December too, which produces some of the biggest volume days of the year in RTY and the underlying stocks. Those are not days to assume normal behaviour.
Who Should Trade RTY
Not beginners, and I say that as someone who trades it daily. RTY punishes two things beginners do: market orders and tight stops. The thin book makes both expensive. Start on ES or MES, get your process stable, learn to read the order flow where it's deep and clean, and then add RTY through the micro.
Where RTY earns its place is for traders who already read the tape. Because it's thin, absorption and big prints stand out more on the footprint, and because it leads at turns, it tells you things about the whole market that ES doesn't. Trading all three index contracts side by side, I usually see the day's first real move in RTY or YM before ES confirms it.
Micro RTY (M2K)
M2K is one tenth of RTY: $5 per point, $0.50 per tick, ten micros to one mini. A median 39-point day is $195 per contract instead of $1,950, and a 10-point stop is $50 instead of $500. That's the right size to learn RTY on, and honestly it's the right size for a lot of people to stay on. The micro trades the same hours, moves tick for tick with the mini, and fills fine for a few contracts. The only cost is commission per contract, which adds up if you're trading ten micros to build one mini. I go through the micro contracts in the micro futures guide, and the position size calculator handles RTY and M2K.
How I Trade RTY
The same way I trade ES: levels from the profile and the overnight, VWAP for who's in control, and the footprint to decide at the level. The adjustments are about the contract, not the method.
- Smaller size than ES. The percentage moves are bigger and the fills are worse, so the same dollar risk needs fewer contracts than you'd think, even though the dollar range is smaller.
- Trade the open and the close. 9:30 to 10:30 and 3:00 to 4:00 are where RTY does its business. Midday is for reviewing, not trading.
- Levels with room. A stop two ticks under the low works on ES. On RTY it's a donation. Give the thin book space or use the micro so you can.
- ES on the second screen. When they agree, trade. When RTY leads and ES lags, pay attention, that's usually the better read.
- Respect rate days. On CPI and FOMC, RTY's first move is bigger and faster than ES's. I'd rather see the news VWAP settle than guess the first print.
Questions People Ask
What is RTY in futures trading?
RTY is the CME symbol for the E-mini Russell 2000 futures contract. It tracks the Russell 2000, the index of about 2,000 US small-cap stocks. One contract is worth $50 per index point, and the micro version, M2K, is $5 per point.
What is the RTY tick value?
RTY moves in 0.10 point ticks worth $5 each, so one full point is $50. M2K has the same 0.10 tick worth $0.50, and $5 per point.
How much is one RTY contract?
With the Russell 2000 around 2,800, one RTY contract controls about $140,000 of notional. You post margin, not the notional: exchange maintenance margin is a few thousand dollars per contract and changes with volatility, and day-trading margins at brokers are a fraction of that. In 2026 the median regular-session range was 39 points, about $1,950 of movement per contract per day.
What is the difference between RTY and ES?
ES tracks the S&P 500 large caps, RTY tracks the Russell 2000 small caps. Both are $50 per point, but RTY trades at a lower price so one contract carries about 60% of the dollar range of one ES. In 2026 RTY moved more in percentage terms, traded about one-eighth of the volume, and closed in the same direction as ES on 85% of days. The NQ vs ES page covers the Nasdaq side.
Is RTY good for beginners?
Not as a first market. It's thinner than ES, so it jumps more and fills worse, and it moves more in percentage terms. Start on ES or MES, then add RTY through M2K once your process is stable. How to trade ES futures is where I'd start.
What is micro RTY (M2K)?
The Micro E-mini Russell 2000, one tenth the size of RTY: $5 per point and $0.50 per tick. Ten M2K equal one RTY. It's the right way to learn the contract.
What are the RTY futures trading hours?
Nearly 23 hours a day, from 6:00 PM ET Sunday to 5:00 PM ET Friday, with a daily break from 5:00 to 6:00 PM ET. The regular session that matters is 9:30 AM to 4:15 PM ET. In 2026 the first half hour produced 52% of the day's range and the 3 to 4 PM hour carried 20% of the volume. The overnight session is covered separately.
Does RTY follow ES?
Mostly. Daily correlation was 0.84 in 2026 and they closed in the same direction on 85% of days, with RTY moving about 1.15 times as much. The days they split are usually about rates or small-cap specific news, and they matter, because RTY often turns before ES does.
Want to learn from a full-time trader who's in these markets every morning? My 1-on-1 mentorship is daily coaching on your own trades, five students at a time.
See 1-on-1 MentorshipKeep reading: ES, NQ, YM & RTY Cheat Sheet • ES Statistics 2026 • NQ vs ES • Micro Futures Guide • Live Futures Prices • All Free Resources