Opening Range Breakout: Does It Actually Work? I Tested It on 200 Days of ES
The 5, 15 and 30 minute ORB, traded by the book on every session of 2026 so far. Win rate, expectancy, how often the breakout fails, the equity curve, and what the opening range is actually good for. Real data, not a YouTube backtest.
Published · by Joakim Jusell
The short version
- I ran the opening range breakout on every ES session from January 2 to October 9, 2026, with 1-minute data. 200 days, three range lengths, four exit rules.
- Win rate is about 50% with a one-to-one target and about 40% with two-to-one. The best version made 0.7 points per trade before costs. The worst lost 2 points.
- 81% of first breakouts closed back inside the range before reaching the target. On half the days both sides of the range broke.
- Trading it every day would have put you up 400 points in March and down 120 by July. That's a 520 point drawdown for a system that ends the year roughly flat after costs.
- The useful part isn't the breakout. The 30-minute range contained the high or low of the day 58% of the time. The opening range is a level, not a trigger.
The opening range breakout is probably the first "strategy" every futures trader hears about. Mark the first 15 minutes, buy the break of the high, sell the break of the low, stop on the other side, done. It's in every book, every YouTube backtest shows it working, and I get asked about it every week.
I don't trade it as a system. But "I don't trade it" isn't an argument, so instead of giving you an opinion I gave it 200 days of real ES data and let it trade by the book. This is what came out. If you're trading ORB right now, read the whole thing before you take another one.
What the Opening Range Breakout Is
The opening range is the high and low of the first few minutes of the regular session, 9:30 ET for ES. Most people use 5, 15 or 30 minutes. The strategy is simple:
- Wait for the range to form. Don't trade inside it.
- When price breaks above the range high, go long. Below the range low, go short.
- Stop on the opposite side of the range, or at the midpoint if you want a tighter stop.
- Target one or two times your risk, or hold to the close.
The logic is that the open is where the most volume and the most information hits the market, and the first move out of that range shows which side won. Toby Crabel wrote it up in 1990, and the idea is old enough that nobody questions it anymore. That's exactly why it's worth testing.
How I Tested It
- Data: ES front-month contract, 1-minute bars, every regular session from January 2 to October 9, 2026. 200 trading days. Rolled contracts on the normal roll dates so there's no stale data from a dying contract.
- Range: 5, 15 and 30 minutes from 9:30 ET.
- Entry: the first 1-minute bar that closes outside the range, long or short, at the close of that bar. One trade per day.
- Stop: the other side of the range. I also ran the midpoint stop.
- Exit: a target of 1R or 2R (one or two times the stop distance), or hold to the 16:15 close with the stop in place.
- Tie rule: if a bar hit both the stop and the target, I counted it as a loss. That's the conservative choice and it's how your fill would go on a fast bar.
- Costs: none in the raw numbers. I show them separately, because they matter here.
No filters, no discretion, no "only if the trend agrees". That's on purpose. Filters are where people hide the fact that the base setup doesn't work, and I wanted to see the base setup. You can find more of the raw opening numbers in my ES statistics page.
Disclaimer: these are hypothetical backtested results, not live trades. Fills are at 1-minute bar closes and costs are estimated, so real results would differ. Past performance is not indicative of future results, and nothing on this page is financial advice or a recommendation to trade any strategy. Futures trading involves substantial risk of loss. See the full risk disclaimer.
The Results
| Range | Exit | Trades | Win rate | Avg per trade | Total 2026 |
|---|---|---|---|---|---|
| 5 min | 1R target | 200 | 50.0% | -0.4 pts | -88 pts |
| 5 min | 2R target | 200 | 34.5% | -0.2 pts | -42 pts |
| 5 min | Hold to close | 200 | 27.5% | -1.4 pts | -282 pts |
| 15 min | 1R target | 199 | 53.8% | +0.7 pts | +132 pts |
| 15 min | 2R target | 199 | 41.2% | -0.9 pts | -185 pts |
| 15 min | Hold to close | 199 | 39.2% | -0.7 pts | -129 pts |
| 30 min | 1R target | 198 | 49.0% | -0.9 pts | -178 pts |
| 30 min | 2R target | 198 | 42.4% | -2.2 pts | -436 pts |
| 30 min | Hold to close | 198 | 42.4% | -1.9 pts | -374 pts |
| 30 min | 1R, stop at midpoint | 198 | 55.1% | +1.4 pts | +275 pts |
ES, January 2 to October 9, 2026, before commissions and slippage. One ES point is $50. The midpoint-stop versions for 5 and 15 minutes were -0.7 and +0.1 points per trade.
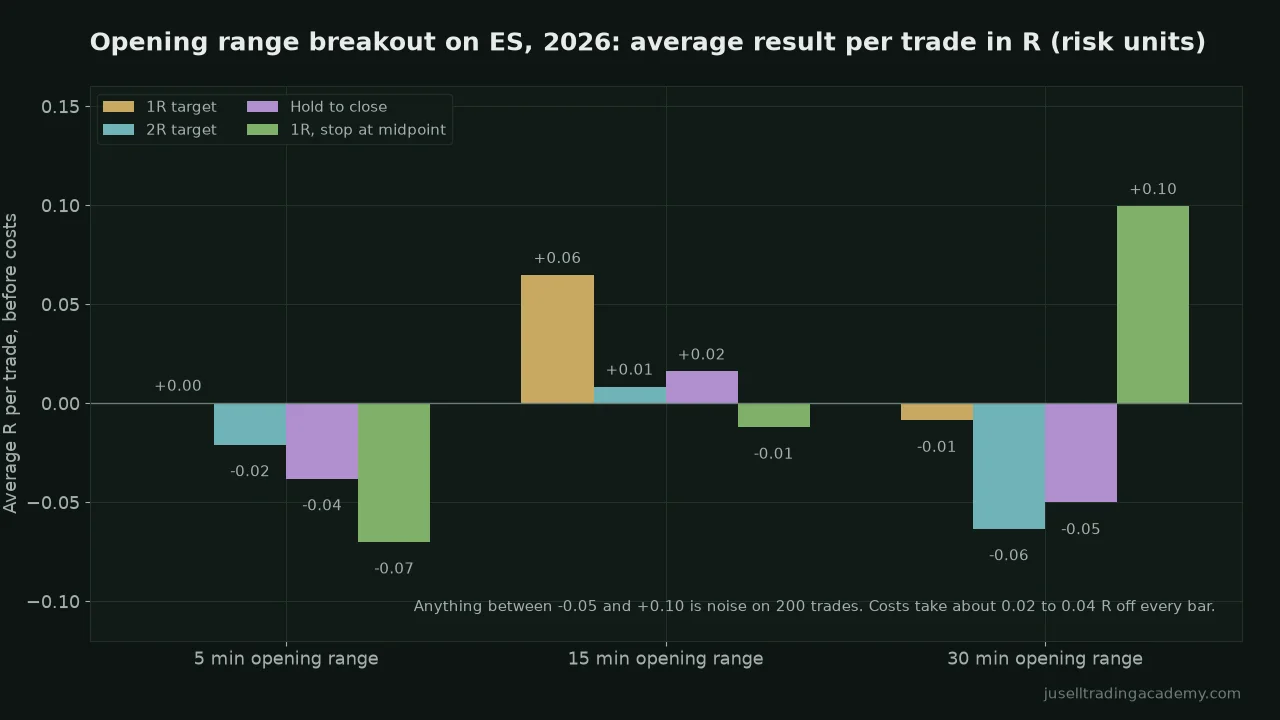
Two numbers look good in that table, the 15-minute 1R version and the 30-minute midpoint version. Before you get excited: the difference between the best and the worst is a handful of trades going the other way. The 15-minute version won 75% in February and 36% in March with exactly the same rules. The same setup, one month apart, with completely different results. That's not a system with an edge, that's a coin that happened to land heads a bit more often this year.
What Trading It Every Day Looked Like
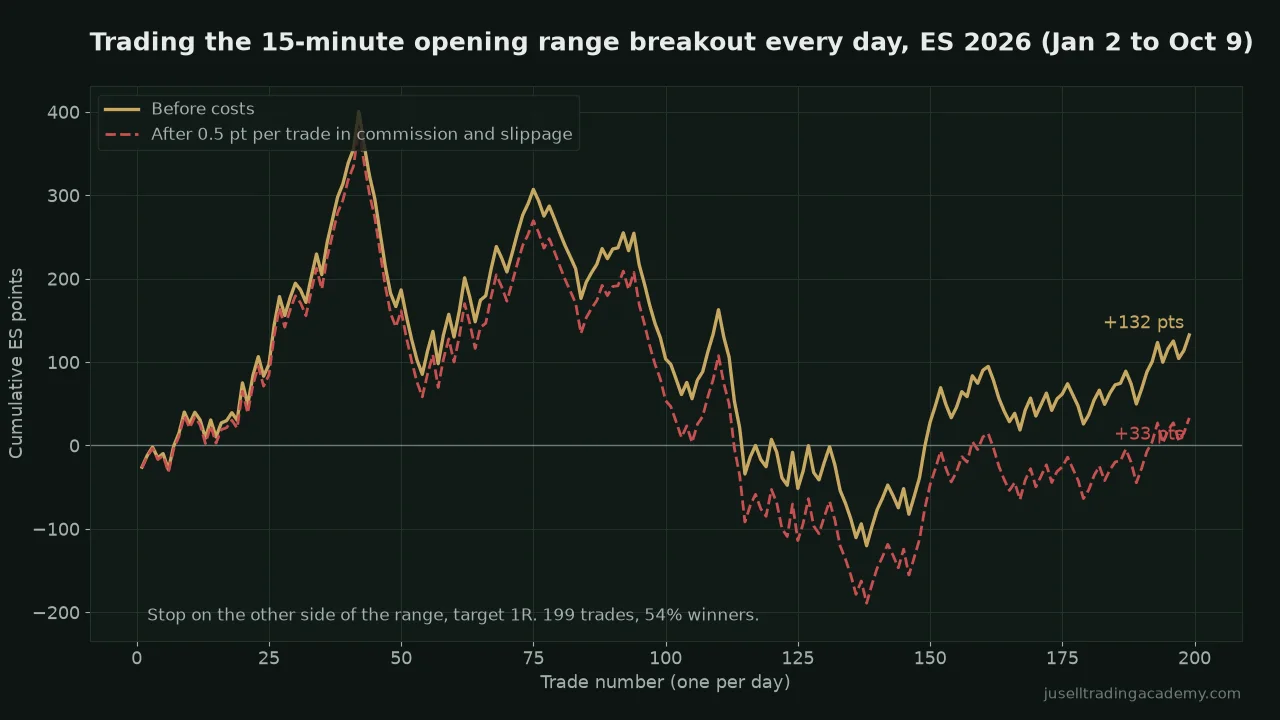
This is the chart nobody shows you. Someone who started trading ORB in January 2026 would have felt like a genius in March, up 400 points. Then they'd have given all of it back and another 120 by July, through a 9-trade losing streak, and most likely quit or started "improving" the system right at the bottom. The ones who kept going got back to breakeven. That's the real experience of trading a setup with no edge: long stretches where it looks like it works, and long stretches where it doesn't, and no way to tell which one you're in.
Average winner was 20 points and average loser was 22 points. Longest winning streak 7, longest losing streak 9. If you want to size this, 520 points of drawdown is $26,000 on one ES contract and $2,600 on one micro. Run that through the position size calculator against any prop firm drawdown and you'll see why ORB blows up so many evaluations.
Why the Breakout Fails So Often
These are the numbers that explain the equity curve.
The breakout happens every single day
On 199 out of 200 days, price closed outside the 15-minute range at some point. On the 5-minute range, every day. So "wait for the breakout" isn't a filter. It's not a signal that something special is happening. It's what price does by 9:50 on a normal Tuesday. Half the breakouts came within 5 minutes of the range closing, and 80% within 15 minutes.
Eight out of ten come back inside
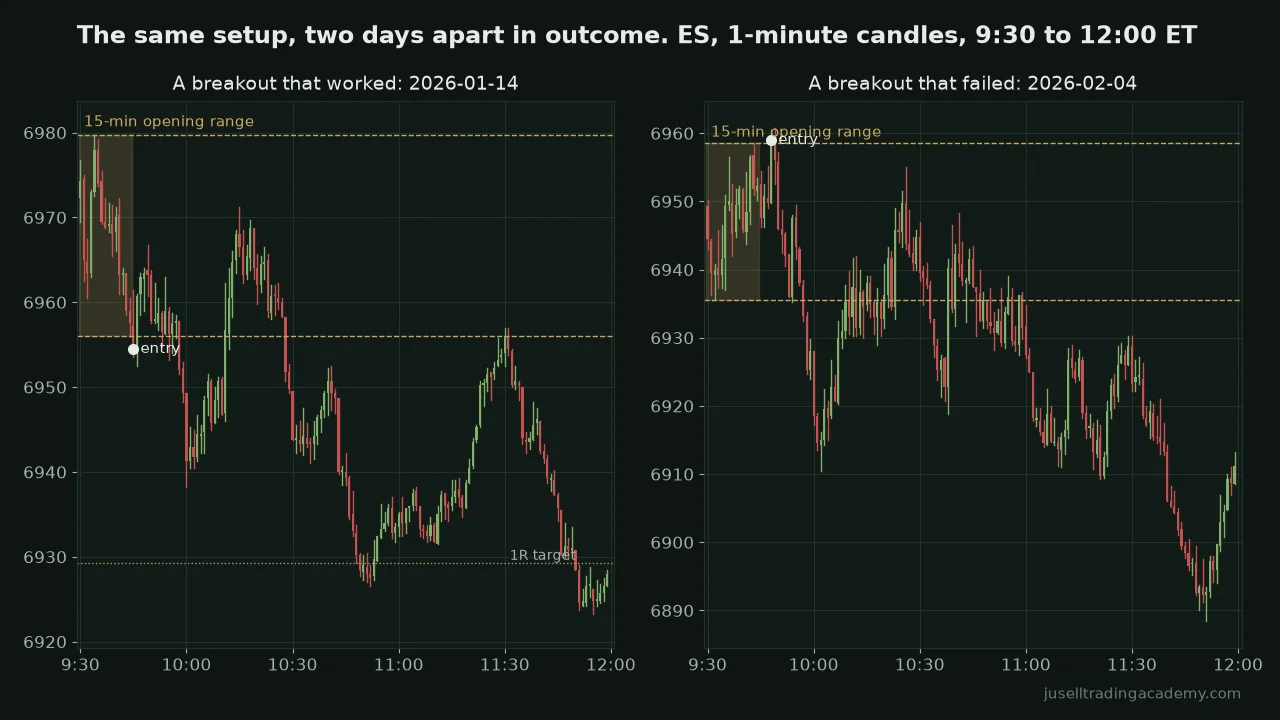
On the 15-minute range, 81% of first breakouts closed back inside the range before reaching a 1R target. On the 30-minute range it was 90%. And 90 to 95% of trades saw price come back and touch the range edge after the entry. Read that again if you've been entering at the break and getting stopped on the retest. That's not bad luck, that's the base rate. The open is where the stop runs live, and the first push out of the range is very often the run, not the move.
Half the days break both sides
On 49% of days both the high and the low of the 15-minute range were broken. On the 5-minute range, 64%. So on a typical day the "signal" fires in both directions. Whichever one you took first was a coin flip, and the data agrees: 53% of the time the day closed in the direction of the first breakout. The other 47% it closed against it.
Costs eat the rest
Half a point per trade in commissions and slippage is a fair number for ES. That's 0.02 to 0.04R off every bar in the chart above, and it turns the best version from +0.7 points per trade into +0.2, and every other version into a loser. A setup that only survives with zero costs isn't a setup.
What the Opening Range Is Actually Good For
The breakout doesn't work as a trigger. The range itself is still one of the most useful things on the chart.
It holds one end of the day more often than not. The 30-minute range contained either the high or the low of the entire session on 58% of days. The 15-minute range, 44%. In other words, on most days one edge of the opening range is a level price never gets past again. That's a level worth marking, and worth watching with the order flow when price comes back to it.
It tells you how big the day is. The median 15-minute range was 19.5 points in 2026, with a quarter of days under 14 and a quarter over 26. A 35-point opening range is a different day than a 12-point one. Your size, your targets and your patience should change with it. The small-range days were actually the better ORB days in the test (59% winners against 49%), which fits: a narrow range breaking is more meaningful than a wide one.
It's where the fight is. The edges of the opening range are where the overnight positions, the opening orders and the early stops are all sitting. When price comes back to the range high after a breakout, you can see on the footprint whether buyers are defending it or whether it's getting absorbed. That's the whole trade. The level tells you where to look, the order flow tells you what to do.
One more thing from the data, with a warning. Monday and Tuesday breakouts won 65% and made +0.25R. Thursday and Friday won 44 to 45% and lost money. Forty trades per weekday is not enough to trade on, so take it as a curiosity, not a rule. But if you're going to trade ORB anyway, the second half of the week is where the data says to be careful.
So, Does the Opening Range Breakout Work?
As a mechanical system on ES in 2026: no. It's a coin flip with a wide stop, and after costs it loses. Anyone showing you an ORB backtest with 70% winners is either showing you one good month, trading with no costs, or has added filters that do the actual work.
And that last part is the real lesson. The people who make money "trading ORB" aren't trading the breakout. They're trading what happens at the range edge: whether the break has volume behind it, whether the retest holds, whether the day is a trend day or a balance day. That's discretion, read off the order flow and the structure, and it's the same skill no matter what you call the setup.
If you've been trading ORB for a year and you're breakeven, that's not a you problem and it's not an ORB problem. It's that the level was never the edge. I wrote about this with ICT too, and it's the same answer: a new system is rarely the answer. Learning to read what price does at a level is.
How I'd Use the Opening Range
- Mark the 30-minute range and treat the edges as levels, the same as the overnight high and low and the prior day's VWAP.
- Don't take the first break. The data says it comes back 8 times out of 10. Let it come back.
- Trade the retest with the order flow. If price breaks the high, pulls back to it, and you see buyers absorb the selling in the footprint, that's a long. If the bids pull and it slices through, that's your short, and it's often the better trade of the two.
- Size to the range. A 26-point stop on ES is $1,300. If that's too much for your account or your prop firm's drawdown, trade the micro or don't take it. The risk rules don't change because the setup has a name.
- Journal it for 100 trades before you believe any of it, including this page.
Questions People Ask
What is the opening range breakout strategy?
You mark the high and low of the first 5, 15 or 30 minutes of the regular session, then buy when price breaks above that range or sell when it breaks below, with a stop on the other side of the range and a target of one or two times the risk. Toby Crabel published the idea in 1990 and it's been in every day trading book since.
Does the opening range breakout work?
Not as a mechanical system on ES in 2026. The 15-minute version won 54% with a 1R target and made about 0.7 points per trade before costs, with a 520 point drawdown in the middle. The 5 and 30 minute versions were flat or negative. After commissions and slippage every version is roughly breakeven.
What is the win rate of the opening range breakout?
About 50% with a 1R target (50% on the 5-minute range, 54% on 15, 49% on 30) and 35 to 42% with a 2R target. Months ranged from 36% to 75%, so a single month tells you very little.
What is the best time frame for the opening range breakout?
The 15-minute range had the best numbers in my test, but the gap between 5, 15 and 30 minutes was small enough to be noise. The 30-minute range is the most useful as a level: it held the high or low of the day 58% of the time.
How often does the opening range breakout fail?
On the 15-minute range, 81% of first breakouts closed back inside the range before reaching a one-to-one target, and on half the days both sides of the range were broken. The first breakout of the day is closer to a coin flip than a signal.
How big is the ES opening range?
In 2026 the median 5-minute range was about 13 points, the 15-minute range 19.5 points and the 30-minute range 26 points. With the stop on the other side of the range, that's $650 to $1,300 of risk per ES contract.
Does ORB work on NQ?
I only tested ES. NQ has the same session with bigger ranges, so the stops are wider in dollars, but the logic and the failure modes are the same. If you trade NQ, run the test on NQ data before you trust anyone's numbers, including mine. NQ vs ES covers the differences.
Who invented the opening range breakout?
Toby Crabel, in his 1990 book on short-term price patterns. The markets, the costs and the number of people trading the open have all changed since then, which is a good reason to test it on current data instead of taking a 35-year-old result on faith.
Been trading breakouts for a year and still breakeven? That's most of the traders who come to me. In my trading mentorship we stop hunting for the setup and start reading what price does at the level, on your own trades, every day.
See 1-on-1 MentorshipKeep reading: ES Futures Statistics 2026 • Liquidity Sweeps and Stop Runs • Order Flow Trading • VWAP Explained • How to Trade ES Futures • All Free Resources